Help
MultiBarcodeSelector & MultiBarcodeMap
Parameters
- Diff. between the most closely related amplicons
- Mimimum and maximum number of differences required in the amplicons for any species with its closest species. Higher values result in stricter outcomes. However, too large difference might indicate the presence of non-orthologous amplicons, such as contaminants or non-target amplifications.
- Amplicon length
- Mimimum and maximum length of allowed amplicons to consider. Higher values result in more available results. However, long eDNA fragments are easier to go into degradation than short ones, while too short amplicons would result in fewer available results.
- No. of barcodes
-
Maximum allowed number of barcodes.
- Usually not need to adjust.
- If the number of barcodes obtained in the results equals to this value, it is recommended to increase it to a higher value and re-run it.
- If you want to check specified barcodes only, please adjust it.
- Only use these loci
- Select one or more genes from the list (12S rRNA, 16S rRNA, COX1 or CYTB), and MultiBarcodeSelector would only analyze barcodes in selected genes.
- Preferred barcodes
- Select one or more barcodes from the list in order, and MultiBarcodeSelector will put the selected barcodes in top.
Results
Recommend Barcodes
Displaying a table in the order of recommended barcodes. "No. Resolved Species" means the number of additionally distinguished species by add this primer compared with the previous one.
By clicking the top-right button or , you can see the detailed list of species.
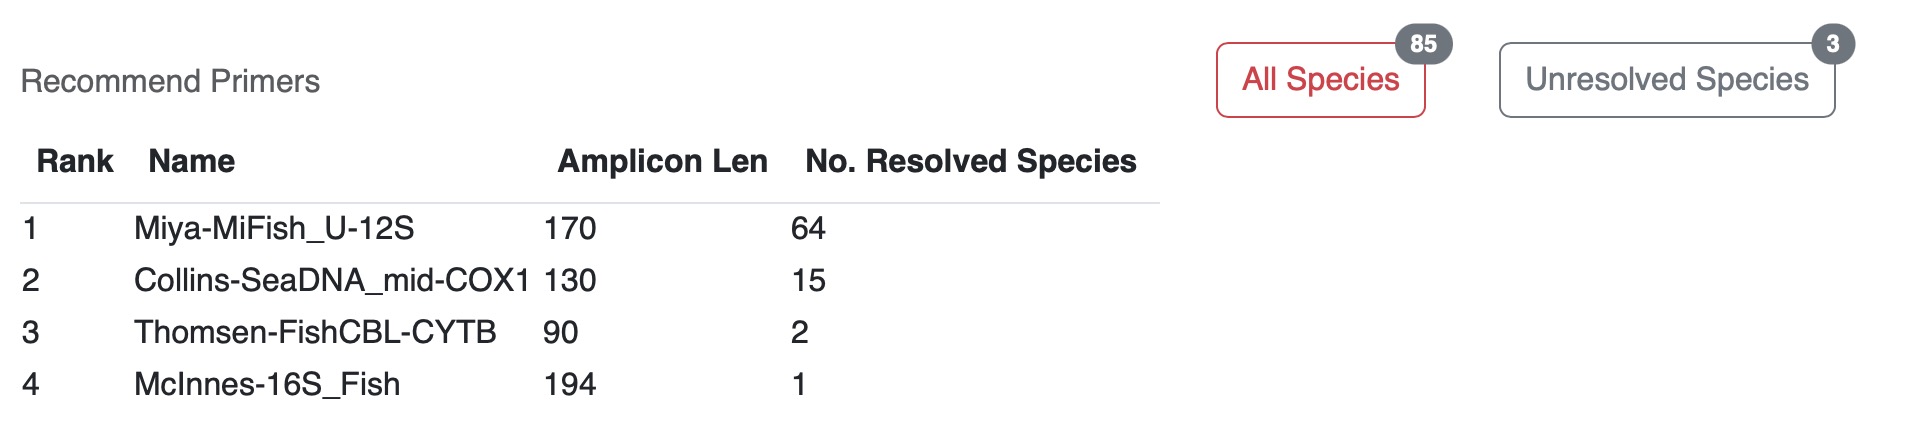
See Full List
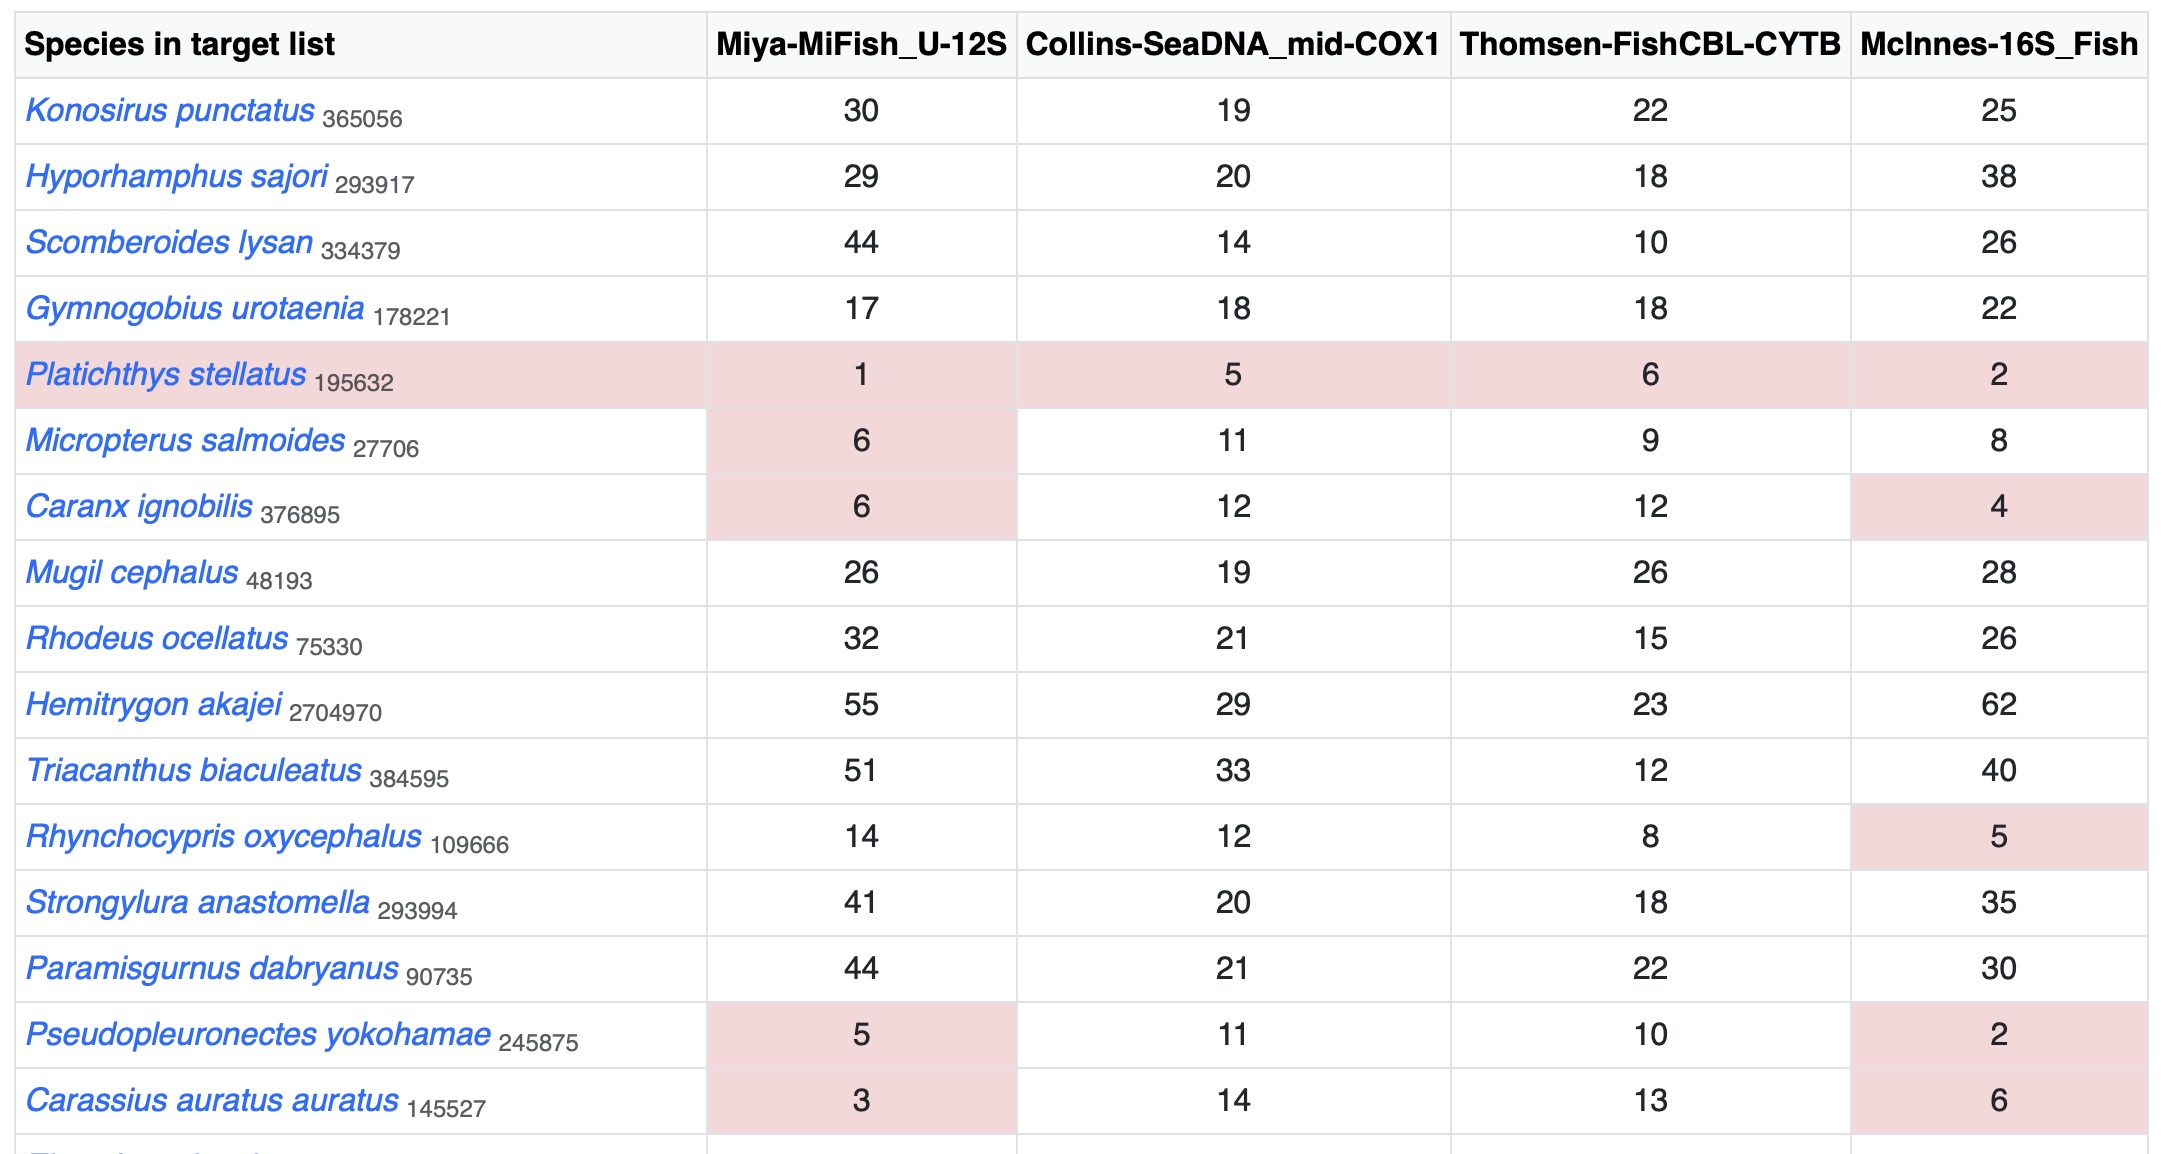
Displaying a table showing the DNA distance (differences) between each species and its most closely-related species.
If the distance is smaller than threshold set in parameters, the cell is marked in pink.
These cells are clickable and a window would be popped out to show features of closely related species.
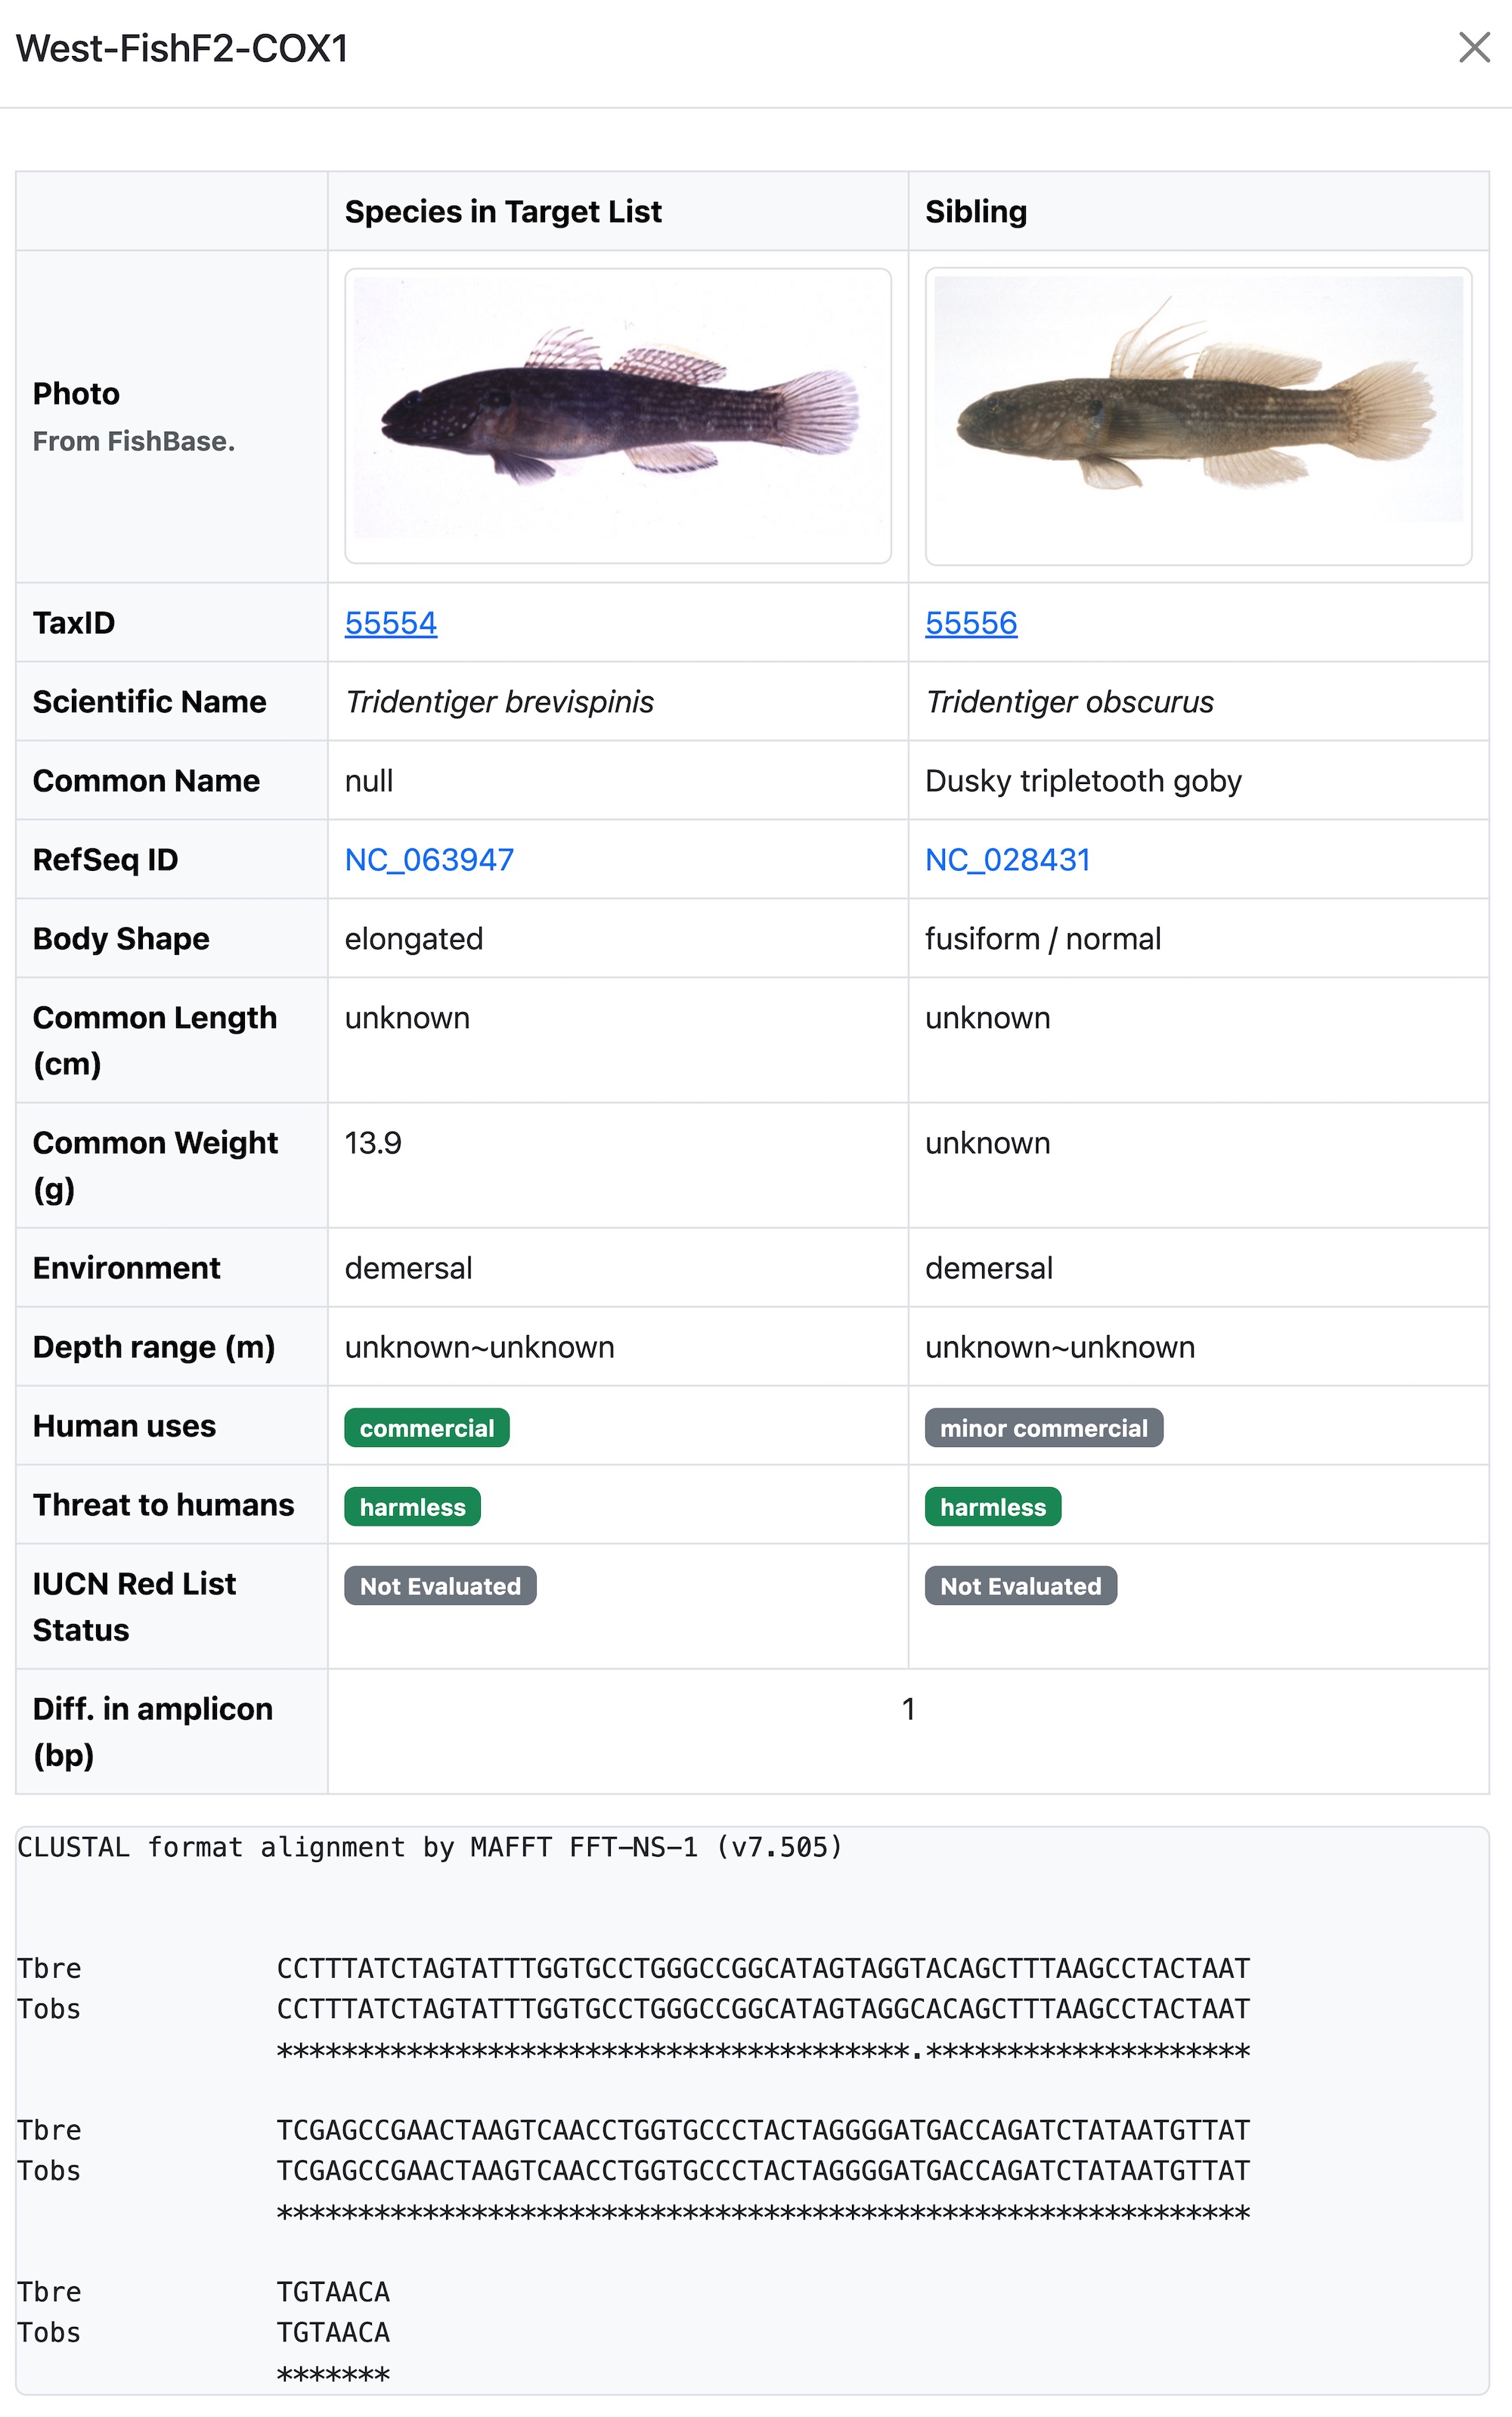
Compare Closely Related Species Pair
This window can be displayed by clicking any cell in the distance table mentioned above. It includes the following items.
- Photo: From FishBase. Might not be available for some species, or might be the same for some subspecies
- Taxon ID, Scientific Name, Common Name, RefSeq ID: From NCBI Taxonomy Database.
- Body Shape, Common Length/Weight, Environment, Depth range, Human uses, Threat to humans, IUCN Red List Status: From FishBase
- Diff. in amplicon (bp): the same value as in the distance table.
- Alignments: showing the on-fly-alignment result of the two amplicon sequences.
Note: This table can help to judge whether this species pair can be distinguished from other features even if they have similar amplicon sequences.
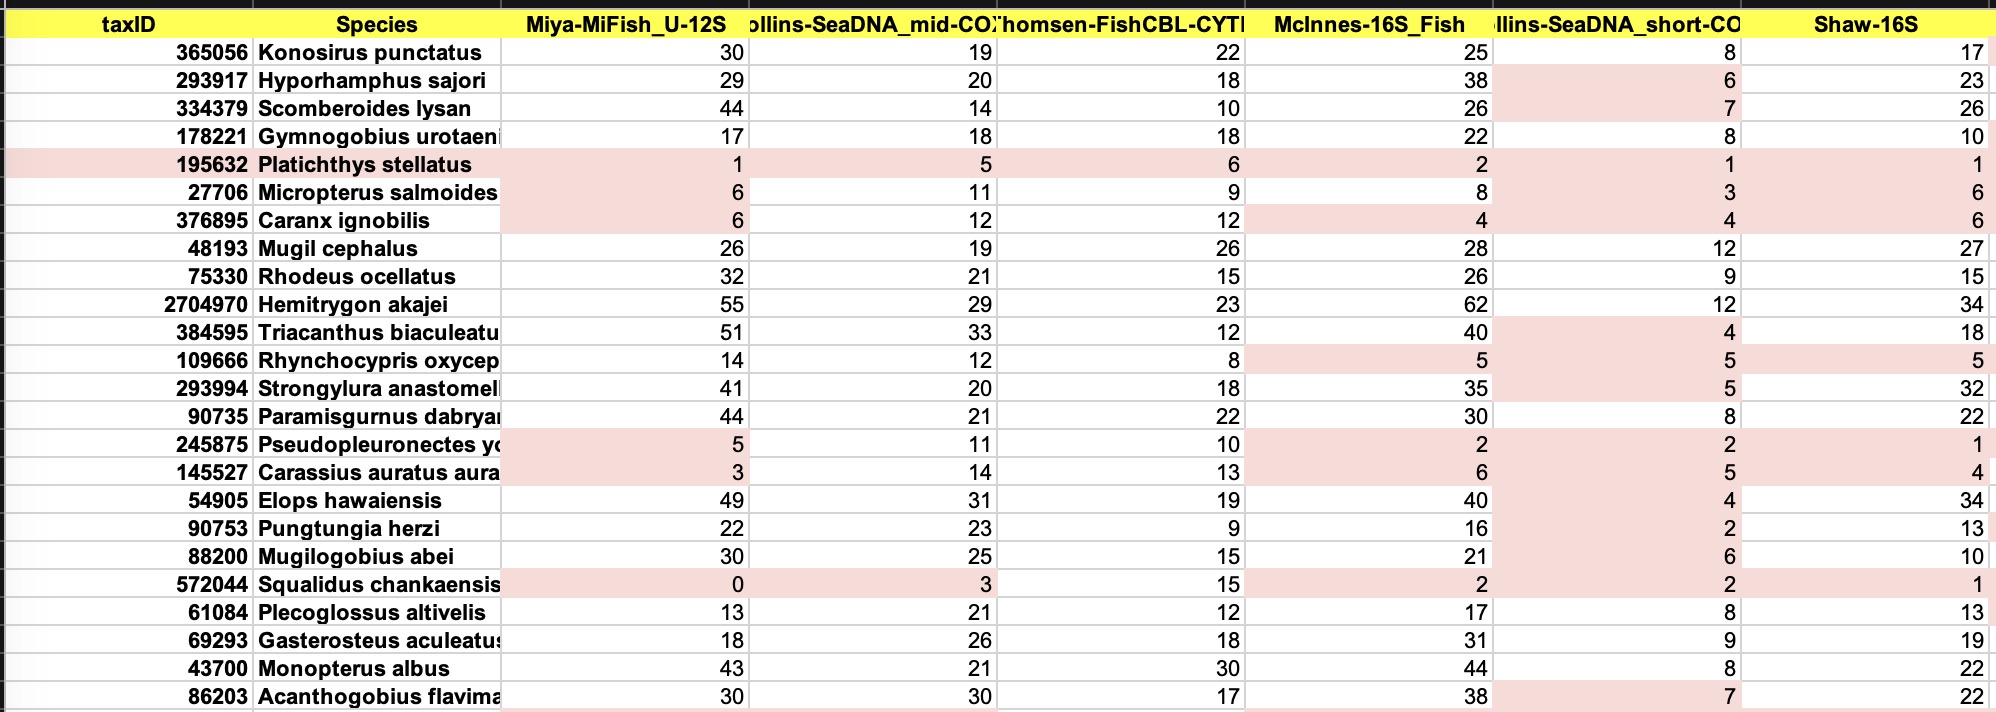
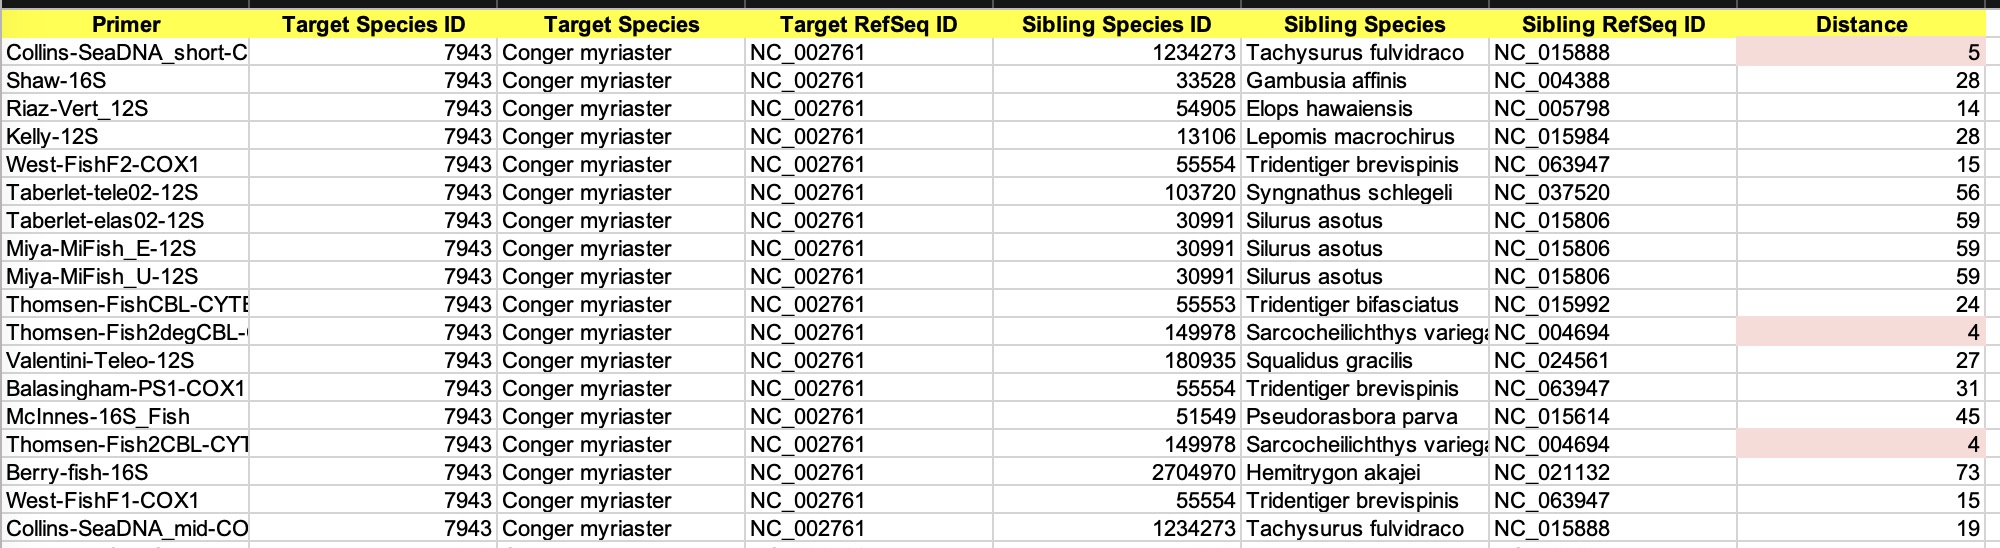
Download in Excel Format
By clicking the button, the results can
be downloaded into a file matrix.xlsx. It has two sheets:
(1) Distance Matrix: Similar as the distance table in the web page, but lists all the primers.
(2) List of Siblings: List all species pairs under each primer.
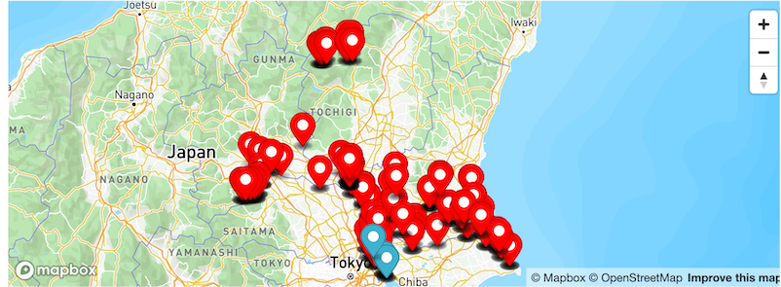
Occurrence (MultiBarcodeMap Only)
Displaying the positions where this pair of fishes were observed.
Red markers: target fish species.
Green markers: closely related fish species.
Tips
- Markers are clickable to show observation details.
- Positions for some fishes in freshwater basins are not available.
- Sometimes red and green markers are overlapped due to the same positions. In this situation, zoom in to see them.
- This map can help to judge whether this species pair can be distinguished from different positions even if they have similar amplicon sequences.
Some Tips
Check Specified Barcodes
Method: Selecting some "Preferred barcodes", and setting "No. of barcodes" to the number of selected preferred barcodes
Result: MultiBarcodeSelector only calculates and reports these selected barcodes and does not recommend other barcodes.
Reuse the Data
Method: Keep species list the same, only adjust parameters, and run.
Result: MultiBarcodeSelector will reuse the previous alignment results and skip the alignment step.
MultiBarcodeMap
Method: Hover on any region in the map
Result: The tooltip indicates number of observed fish species and number of fish species with complete mitogenomes
in this region. For example, Num: 61/124 indicates that there are 124 kinds of fish species
observed in this region, and among which 61 have complete mitogenomes.